


Written by: John Storey
Follow him on Twitter: @JohnStorey_
Follow Prospects Worldwide on Twitter: @ProspectsWorldW
In 2020, the Toronto Blue Jays graduated to the next phase of their rebuild. Not only did they find themselves in the Postseason for the first time since 2016, but also, their top prospect, Nate Pearson, made his Major League debut. The Florida native arrived with much fanfare. Toronto’s top prospect was ranked sixth overall. And for good reason. With upper nineties fastball velocity, Pearson is going to be competitive no matter who he’s facing.
To amplify the drama, Pearson made his first start against Washington Nationals ace, Future Hall of Famer Max Scherzer. It was a can’t miss game. And Pearson didn’t disappoint. Using 75 pitches to get through five shutout innings of work he allowed two walks and two hits. It was an overwhelming success and the arrival of a new age in Toronto.
Reflecting on Pearson’s season, three starts, four outings later, it’s obvious he’s ready to take the next step and make his case to be among the game’s elite. However, he’s not quite there yet. His command remains a limiting factor. This isn’t anything particularly new. Pearson’s ability to control the baseball has, throughout his career, always lagged behind his other tools. But after seeing a sample of big league work, it’s now clear what sort of impact it will have on his game.
As established, he’s shown he can be a productive arm. But without polishing his consistency, he’s going to struggle to reach his ceiling. What can we learn from his first 18 major league innings and what’s next?
For one, Pearson had a difficult time finding any precision with his pitches, particularly his fastball and slider – his most frequent offerings.

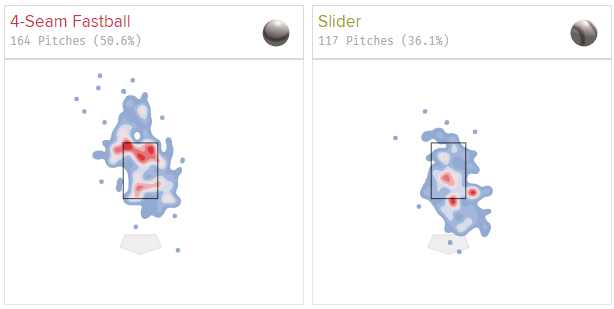
Despite keeping his fastball at the top of the zone, he showed a propensity to spray his pitches instead of commanding them to any specific point. Now, it’s acceptable for someone with Pearson’s velocity to deviate slightly from the command expected from other starters, however, he’s still a step away from even that.
Take the percentage of pitches he threw for a strike. 38.9% of Pearson’s pitches landed in the strikezone. That doesn’t hold up well against the competition. In 2019, had he qualified, he would have ranked 54th among 62 qualifiers. In 2020, he would have ranked 28th of 41. Naturally, there’s less demand for pitches inside the zone if a player can induce swings and misses.
Given that Nate can get hitters swinging, he shouldn’t have to maintain a lofty zone rate. However, he must maintain an ability to deceive batters. Throughout his minor league career, this is exactly what he’s done. Achieve high strikeout rates thanks to high swinging strike rates.
If you need any confirmation of the validity of swinging-strike rate just look at the leaderboards: Jacob deGrom, Shane Bieber and Lucas Giolito dot the top. Nate Pearson’s swinging strike rate is nearly half that of deGrom’s (33.1%) at 18.1%. Had he been one of 101 qualifiers in 2020, he would have placed 62nd. It’s far from terrible, however, he would be among Kyle Hendricks (63), JA Happ (70), Anibal Sanchez (60) and Dallas Keuchel (67). While all are great players, Pearson is capable of more. He’s capable of moving much closer to the aforementioned swinging strike leaders.
Isolating performance inside and outside the strikezone is difficult as strikeout and walk rate are independent measures. We can still gain a rough estimate as to the productivity foregone by Pearson’s precision.
| BABIP | wOBA | xwOBA | |
| Strikes | .189 | .278 | .288 |
| Balls | .200 | .422 | .367 |
There is little point in discussing these benefits at length. After all, this is just quantifying the advantage of throwing strikes – not exactly an advanced sabermetric concept. But the fact remains that throwing strikes is more critical for Pearson than it is others. Not just because it multiplies the value of his velocity, but because of how detrimental it’s already been to his performance. Right now, falling behind in the count is costing Nate Pearson more than it is other pitchers.
After falling behind 1-0, Nate Pearson’s OPS+ relative to the rest of the league (after a 1-0 count) was 120. He was 20% worse than other pitchers after missing with his first pitch. In the ultimate small sample, Pearson failed to recover from any of his seven 3-0 counts, walking a hitter each time. After seeing 19 2-0 counts, hitters drew 11 walks leading to an on-base percentage of .625.
Pearson’s turmoil preventing hitters from reaching base is not abnormal – especially when isolating hitter-friendly certain counts. However when considering his, not abnormal, pitch patterns, the trend illuminates the significance of his struggle to command his fastball.
| Nate Pearson, 2020 | Plate Appearances | Fastball Rate | Walk Rate | On-Base Percentage |
| All Counts | 81 | 50.6% | 16.0% | .333 |
| After 1-0 | 39 | 47.37% | 30.77% | .462 |
| After 2-0 | 19 | 71.43% | 57.89% | .632 |
| After 3-0 | 7 | 80.00% | 100% | 1.000 |
Compare that to all of Major League Baseball:
| MLB, 2020 | Plate Appearances | Walk Rate | On-Base Percentage |
| All Counts | 66,506 | 9.16% | .322 |
| After 1-0 | 26,578 | 15.96% | .381 |
| After 2-0 | 9,405 | 31.15% | .502 |
| After 3-0 | 3,051 | 63.23% | .742 |

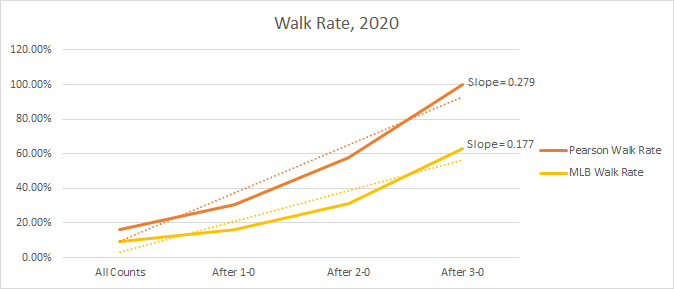

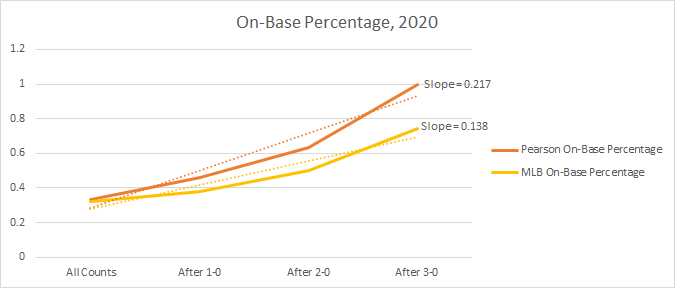
Nate Pearson, like every pitcher in baseball, throws more fastballs as he falls behind in the count. As a result, he’s ended up with higher than acceptable walk rates and on-base percentages. Not only do these values exceed that of Major League Baseball in aggregate, but they also increase at a higher rate than Major League Baseball (alongside Nate’s increasing fastball usage). Under the assumption Major League fastball usage increases at a rate no more than Pearson’s, this, although not statistically strong evidence, is evidence nonetheless emphasizing Pearson’s poor fastball command.

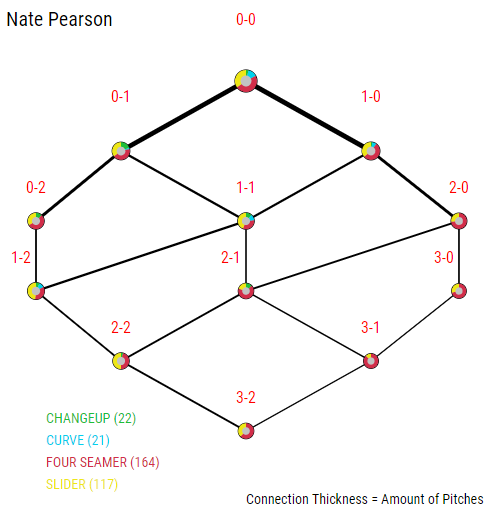
Nate has two next steps to improving his command and results. For one, he can use his slider more. Pearson’s slider is as strong an asset as his fastball. And while he gave up “bigger” hits with it in 2020, it ultimately garnered better results. Despite giving up three of the five home runs Pearson surrendered in 2020 on a pitch he threw just 36.1% of the time, the slider was a great tool. It collected far lower expected stats than his fastball. Nate Pearson’s slider is a classic case of how results and perceptions can impede productivity and prevent development.
| Nate Pearson | BBE | BA | xBA | SLG | xSLG | wOBA | xWOBA | Whiff Rate |
| Slider, 2020 | 18 | .240 | .212 | .600 | .382 | .363 | .273 | 34.7% |
After falling behind in the count so often, Pearson was forced to go to his fastball more than he otherwise would (or should) have. Regardless of the rate Pearson can overcome falling behind in the count, throwing his slider even if he’s behind in the count could help to off-set his currently underdeveloped fastball.
The change that Pearson will have to make whether he chooses to use his slider in more critical situations or not is to refine his mechanics. A more repeatable delivery will aid in allowing Pearson to find a more consistent release point. Against 2020 BB/9 leader Kyle Hendricks, Pearson’s release is sloppy.
| Standard Deviation of Horizontal Release Position | Standard Deviation of Vertical Release Position | |
| Nate Pearson, 2020 | 0.173 | 0.114 |
| Kyle Hendricks, 2020 | 0.117 | 0.094 |
Nate Pearson is a high ceiling pitcher. He has been for some time time. However, after a cup of coffee with Toronto, it’s clear he still has work to do before becoming the Blue Jays’ ace. Once Pearson grows as a pitcher and refines his delivery, he’ll be mowing down big-league hitters with ease.
Find all our 2020 MLB Playoff Coverage Here!
As we cover each series as the Playoffs unfold with an Analyst assigned to each series!
Follow us on Twitter @ProspectsWorldW
SUBSCRIBE To our YouTube channel! For amateur and Minor League prospects