


Written by: Kai Franke
Follow him on Twitter: @KaiFranke3
Follow Prospects Worldwide on Twitter: @ProspectsWorldW
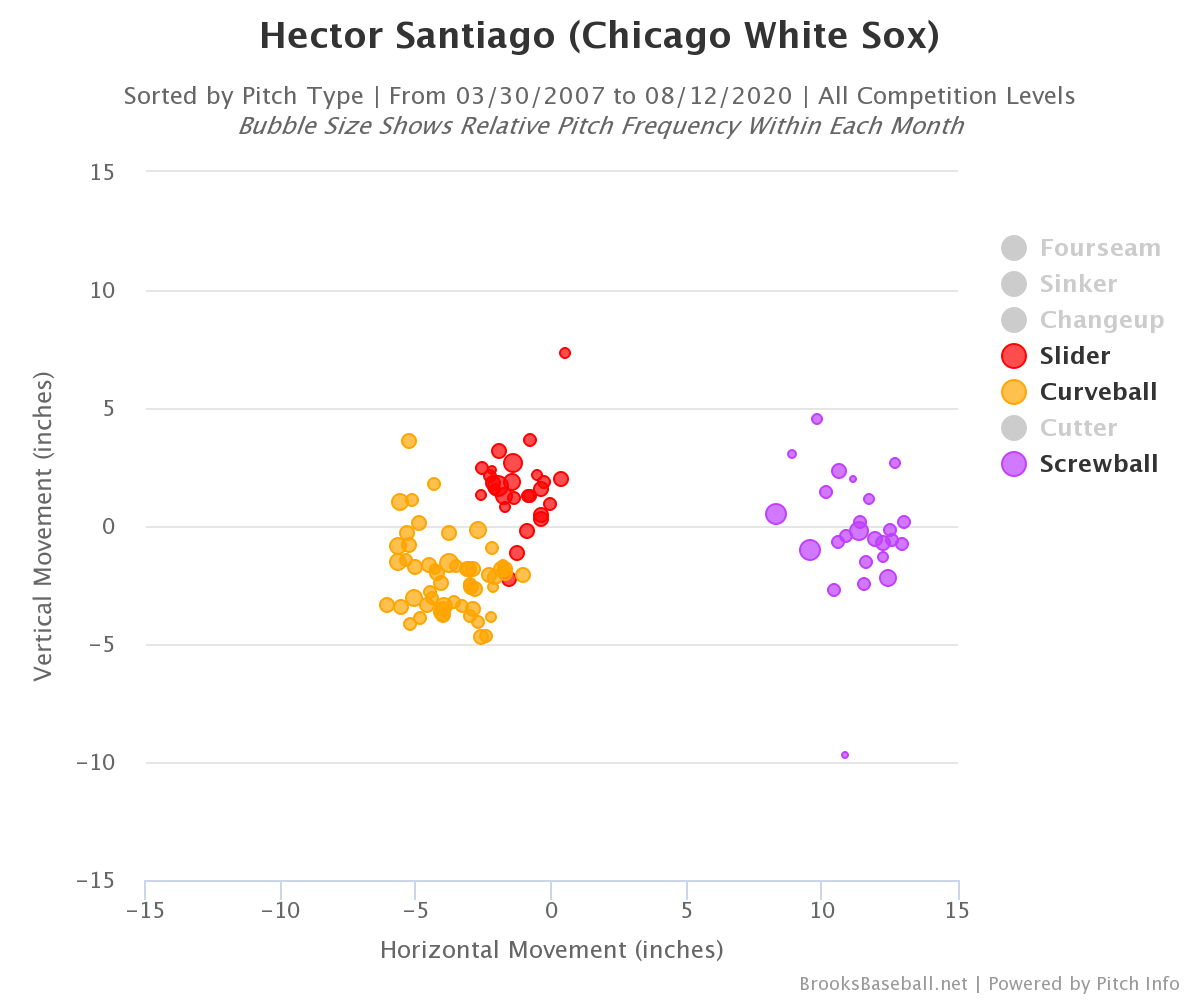
The screwball has been one of the biggest mysteries in baseball throughout its history. When Christy Mathewson first threw it, not many were able to figure out what it was, as it was never seen before, many called it a “fade” as it faded away from hitters. The movement profile of the pitch is the opposite of a slider or curveball. Here’s an example from one of the only pitchers to throw the screwball in the past decade, Hector Santiago:

However, even with this crazy movement profile, the pitch has been a dying breed under the belief that pitcher’s UCL’s would be destroyed while throwing it. I decided that I wanted to dive in on the screwball and see if those assumptions were true, and how a pitcher could design a good screwball if they were to throw it.
Santiago had an article written about him in the New York Times back in 2014 (you can view that here). Not only did they talk about him, but they went to a biomechanics lab to see if the screwball created more or less stress on the elbow than any other pitch, the results were interesting, to say the least.
According to this experiment, the screwball actually had about the same amount of stress on the elbow as a normal fastball. They only used one pitcher in the experiment, but this shows at the very least that some pitchers can use it and not get hurt.
While that looks good for screwballers, there are still some that end up getting hurt while using it. Brent Honeywell, the 71st best prospect in baseball according to FanGraphs, throws it and has been out for the past two years due to Tommy John Surgery. The two may not be directly related, however, it is something to point out as throwing the screwball definitely could’ve caused it. Here’s a video of him getting a whiff on a left-handed hitter:

This pitch is nasty, I also wanted to look at his movement charts as well to see how the pitch plays off of his curveball and slider:
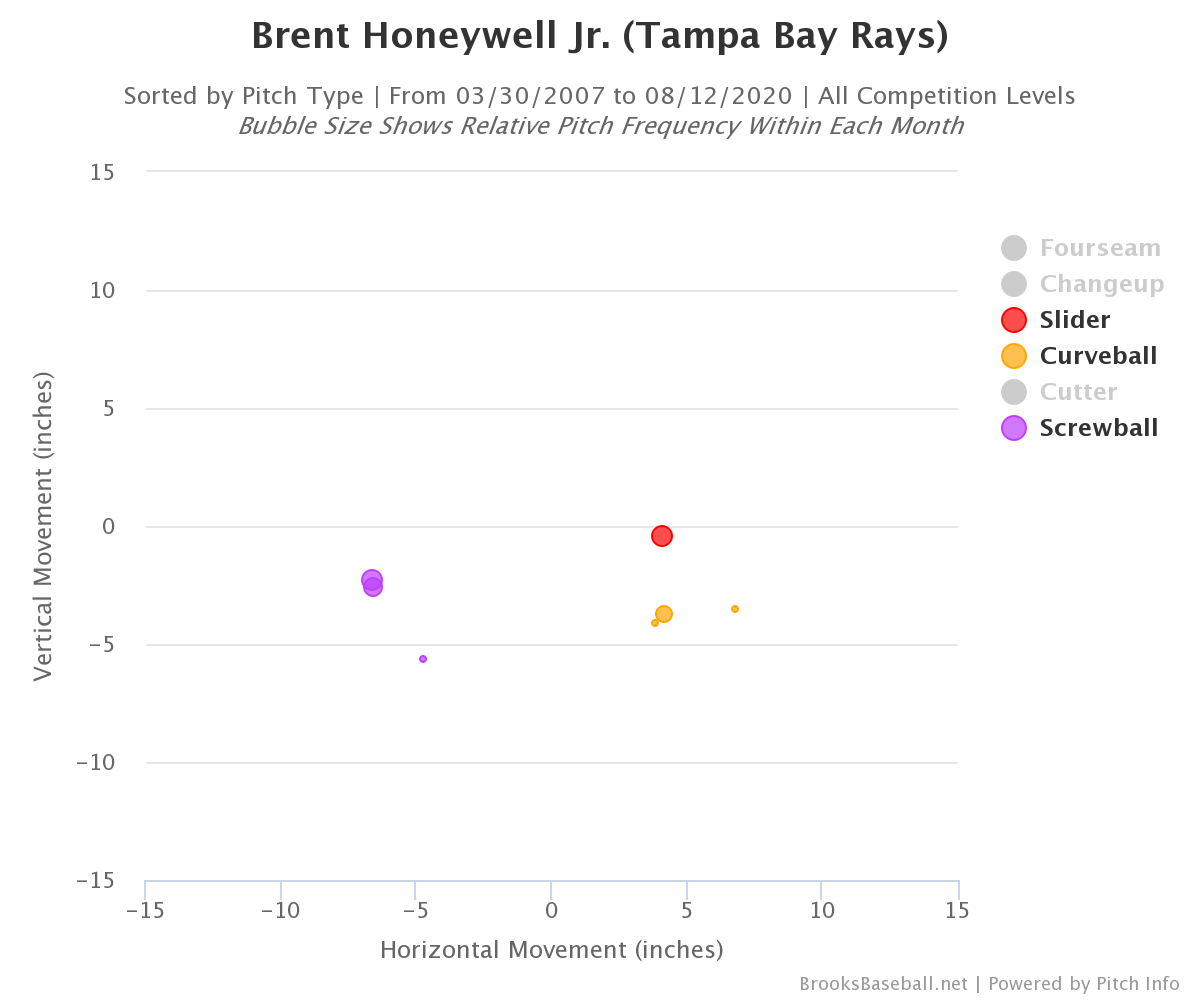
It seems as though the screwball moves more horizontally than the other two, with about the same vertical drop. This pitch could play off of the other two very well and be effective in the big leagues.
With this possibility that the pitch isn’t as stressful on the elbow than originally thought, I wanted to investigate how a pitcher could utilize it to be successful. There isn’t much pitch-tracking data with the screwball, so there will not be much of a sample size. There have been only four pitchers that recorded a screwball in MLB during the pitch tracking era, they are Daniel Herrera, Yoshinori Tateyama, Alfredo Simon, and the previously mentioned Hector Santiago. I wanted to do this by finding the average location of the pitches, where hitters whiff, and locations that gave pitchers good results.
To do this, I went into RStudio to cook up some heatmaps to see where each pitch was successful. First, I wanted to see where pitchers threw the screwball to righties and lefties most often, so with the help from Matt Boyd, I was able to do this. Here they are (catcher’s view):
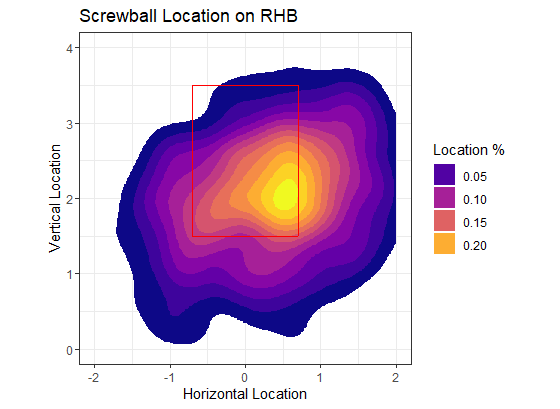
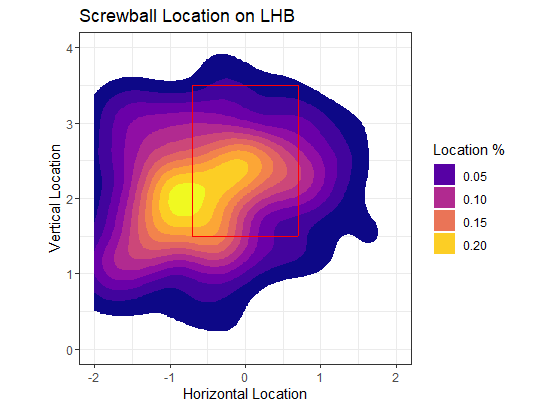
You can see that pitchers liked to throw the pitch down and away to hitters, most of the data here is from left-handed pitchers, so it is moving away from righties and into lefties. It seemed as though it wasn’t able to be controlled very well, which is something I’ll get into later, as the whole heat map is very spread out, even ending up in the opposite batter’s box at a somewhat significant rate.
Also, something else to pick out here, left handed batters were able to see a decent amount of screwballs right down the heart of the plate as you can see that yellow-orange in that location, indicating that it is thrown there more than the other areas besides that circle on the outside paint. This could mean that the pitch broke back into the middle of the zone and gave the batter a cookie, that would not be good.
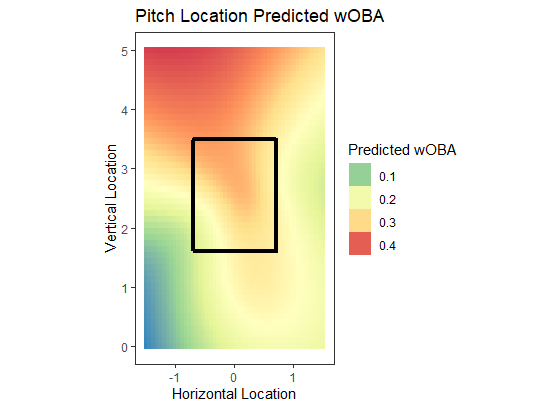
Not only did I want to figure out where pitchers typically threw the screwball, but I also wanted to figure out where it was most effective. So, with help from Spencer Weisberg and Alex Caravan, I was able to do this as well. I made a heat map based on whiffs and one on predicted wOBA, as there weren’t enough batted balls to get a great dataset out of. Here they are:
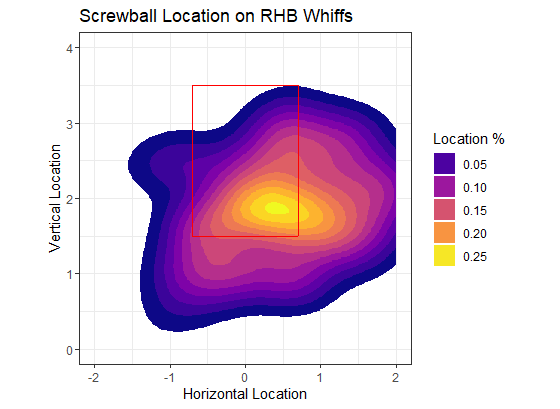

Both of the whiff charts seem very similar as before, however, the location percentages on the legend went up, showing that this bright yellow here is a higher percentage than the previous charts. This shows that if a pitcher can locate a screwball low and away from hitters, they’ll be able to generate a ton of swings on misses on it, but if it is thrown up, the batter is more than likely going to make contact.
For the predicted wOBA heat map, we see somewhat similar results. If you throw the ball down the middle and up, it’s going to be crushed, if you throw it on the low corners, the pitcher will have great success. Most of that strike zone looks dangerous, so getting hitters to chase would be very beneficial for the pitcher as well.
One more thing that I wanted to check out was how the screwball did against righties and lefties separately. You hear about not throwing sliders into hitters, so I wanted to see if this held up with the screwball, since it’s about the opposite of a slider. This would mean that a left-handed pitcher should not throw a screwball to a lefty since it breaks in towards him. To do this, I went into RStudio and figured out the wOBA for each handed hitter. Against left-handed pitching, lefties hit for a wOBA of .192 and righties hit .259, a significant difference, and proves my hypothesis wrong. This is likely due to lefty/righty splits more than anything.
The only problem with trying to locate the screwball is that it is an extremely hard pitch to throw. Even Hector Santiago said that he didn’t even know where it was going to go when he threw it, so trying to command it extremely well is tough. To see how much control the pitchers had with the screwball, I wanted to figure out the strike percentage for it. Again, I went into RStudio to figure this out, and as expected the result wasn’t very good. Pitchers in the pitch-tracking era have only thrown the screwball for strikes 39.3% of the time.
If a pitcher is somehow able to control this very well, the bright yellow spots in the heatmaps above would be the best spots to put them. Again, that task is very difficult and a pitcher would need to find a way to master that skill.
My problem with the study that I had stated earlier is that they only used one pitcher. It could be that the way he threw the screwball didn’t put much stress on his elbow, if that experiment had included multiple pitchers that throw the screwball (screwballers are hard to find), then it could be much more believable. But for now, we don’t have that information. Brent Honeywell has gotten hurt already early in his career and has already had Tommy John Surgery, meanwhile, Hector Santiago had a nine-year career with a 2.8 WAR and a 4.91 FIP per FanGraphs. This just shows how much we don’t know about arm problems with the screwball, and there’s more that needs to be done.
When we can get that information and figure out if and how a pitcher can throw the screwball with less risk, it could make for a good pitch. According to Baseball Savant, in the pitch-tracking era, hitters managed a .233 wOBA, .294 xwOBA, and struck out 25.5% of the time against the pitch. With biomechanics seeming to be the next big pitching development tool, I see this happening soon.
If you want to see all of my code for this project, you can find it in the GitHub link here.
A special thank you again to Matt Boyd, Spencer Weisberg, and Alex Caravan for help on this project!
ALL STATS FROM BASEBALL SAVANT AND FANGRAPHS
ELBOW STRESS STUDY FROM THE NEW YORK TIMES
Follow us on Twitter! @ProspectsWorldW
SUBSCRIBE To our YouTube channel! Amateur and Minor League Prospects!